
![]()
I’ve been doing an interesting project, writing some LoRa code in Python on an ESP32. There are lots of resources on the web, including other example codebases in github etc, which means I didn’t have to start from scratch.
Fairly quickly I was able to wire up an ESP32 module, an SSD1306 I2C OLED module, and an SPI connected Semtech SX1276 LoRa module, and get everything talking with microPython. Python is great for getting things working quickly, and the resources provided by the ESP32 means it can run python at a reasonable speed, provided you code thoughtfully.
With the SX1276 transmitting LoRa spread-spectrum data, looking at the output on a spectrum analyzer is rather fascinating. The SX1276 performs its spread-spectrum magic by using a derivative of CSS – Chirp Spread Spectrum. Essentially it’s encoding several bits of data into each of multiple FM chirps. The result is a signal that varies its frequency & amplitude over time, but within a bounded range.
Here in North America the 915 MHz license-free band is used. The images and videos below are all centered at 915 MHz, with a 500 kHz span (ie 50 kHz per division). The following image shows a capture of a single transmission. Note the weird shape.
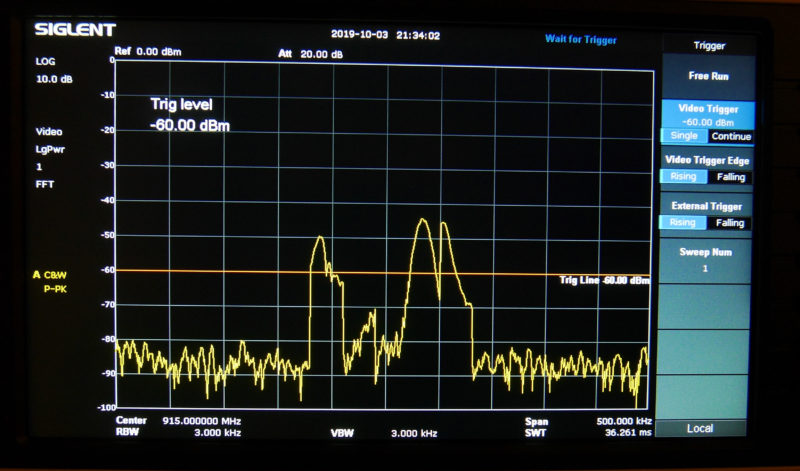
I wrote a little python to transmit a small message every 500 ms. Then set a trigger on the spectrum analyzer to catch & display the transmissions. In the following video you can see the individual transmissions being sent. Notice how they all appear to have different shapes, and they all look rather random.
Setting a trace on the spectrum analyzer to max-hold and repeating the experiment reveals something else interesting. See the following video.
With one message every 500 ms, you can see how cumulatively they managed to fill a well defined piece of spectrum given sufficient time.
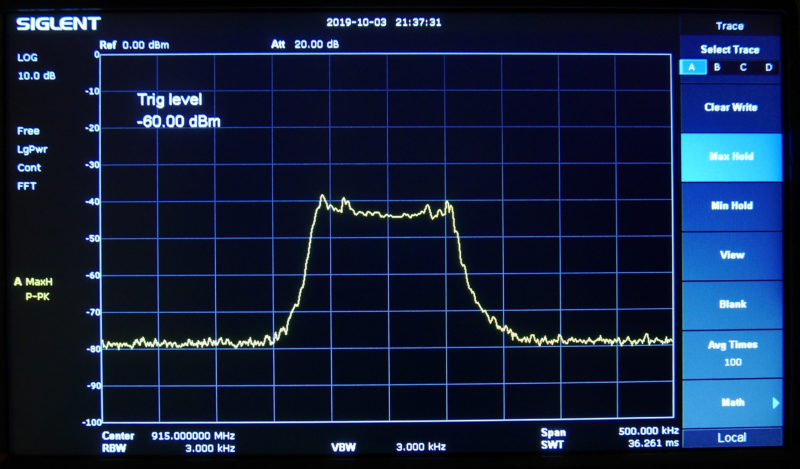
The 20dB bandwidth used by the LoRa signal in this case is approximately 150 kHz. But as we’ve seen in the videos, it uses random-looking pieces of the bandwidth at a time, hopping around to only utilize the entire 150 kHz over time. Very interesting.
It’s described in the post. You can see the SA settings on the screenshots. Just enable peak-hold on the SA so it keeps the spectrums on the screen.
can you explain which mode and settings did you do in the spectrum analyzer to get those results.
Is there a way to have a smaller screen display frequency vs time information
Frank
i am new in thos subject.
I have and wemos esp32 board, can i use it to develop your assay?
thanks a lot
Hello Frank
I hope that you have enjoyed with your experience in communication with Lora Protocole, the last figure is juste fascinating, i have a little question, have you an idea on how we can display the lora Packers on the spectrum Analyser ?